Extrapolating Private Home Blast Vibration Data.
Blasting -> Extrapolating Private Home Blast Vibration Data
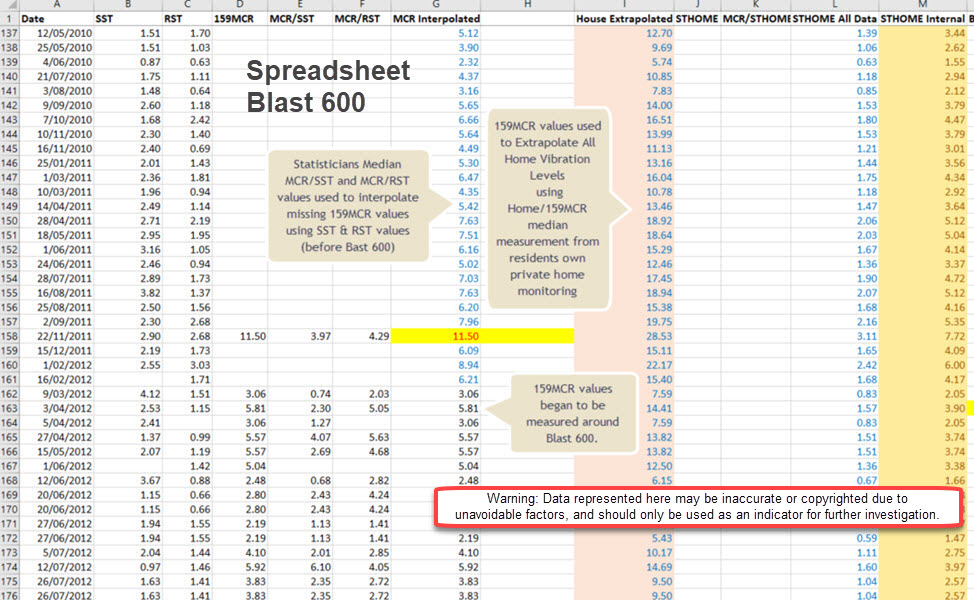
Calculate Extrapolated Private Home & Stuartholme Blast Vibration Data.
Calculate the Vibration level Group Counts in Chart Form.
Apparent or Indicated Excess Counts (in the home).
Calculate Extrapolated Private Home & Stuartholme Vibration Data (as best we can).
Applying the Home/#3SSGD Upsize Median Value:This is an earlier process which used the average #3SSGD upsize to determine an approximation for the unmonitored 3SSGD data.
The purpose of this was to create an overall Blast Strength Distribution Table.
The Local Residents believed that they had established, beyond reasonable doubt, that both the 3rd August noise recording plus the actual home vibration measurements, indicated upsizing process validity.
Hence for the first time, the partially interpolated #3SSGD values were used to give an estimate of what effect the blast vibrations from 2001 to 2017 had on the actual homes.
Thus the extrapolated private home blast vibrations from January 2001 - March 2017 were created.
Acording to the legacy DA, 10% of all Quarry Blast Vibration values above 10mm/sec are legal, however only if they are in the correct sequence (lower values in one year do not always justify higher values in any following year.)
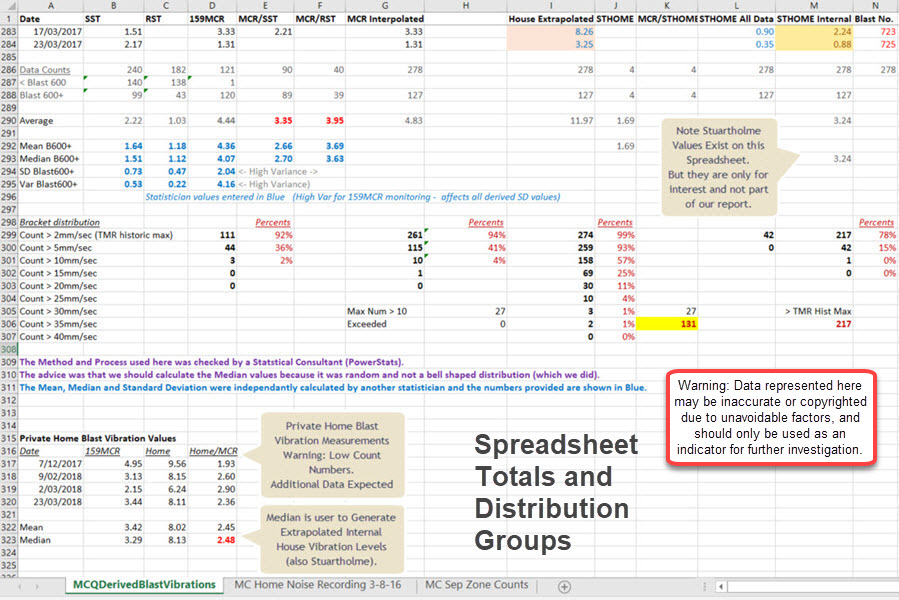
Calculate the Vibration level Distribution Group Counts in Table Form.
The distribution of these values is as follows, (but does not consider the 10% legality rule mentioned above):
Vibration Group
Counted Readings
% of all Readings
> 2mm/sec
274
99%
> 5mm sec
259
93%
> 10mm/sec
158
57%
> 15mm sec
69
25%
> 20mm/sec
30
11%
> 25mm sec
10
4%
> 30mm/sec
3
1%
> 35mm sec
2
1%
> 40mm/sec
0
0%
Apparent or Indicated Excess Counts (in the home)
Blasting measured in Noise Sensitive private dwelling)
Description
Number Counted
Total Blast Count
274
Max Allowed > 10mm/sec
27
Total Number > 10mm/sec
153
Total Excess > 10mm/sec
126
Notes
1. The data here were manually copied from the Second RTI Data Excel Spreadsheet.
As the third RTI data version indicated some changes by the BCC MCQ, the above may not always indicate the latest data.
2. The #3SSGD data was originally extrapolated using a 2 dimensional model. At the time, thus was used because it was the only method available.
This is now redacted in favour of the Secret Weighbridge Quarry Office Blast Vibration RTI Data
3. The quarry management shoud have permanent monitoring site vibration readings near the closest homes, but they chose not to do this.
Instead the MCQ manager deliberately chose to quote Sussex St data, which was several times further away from their KRA-42.
4. The Internal Home vibration readings were extrapolated from 10 private home monitoring results.
This is a very significant burden on the local residents finances which should be paid by the BCC.
5. The Local Residents approached Dr John Heilig to extend their blast vibration monitoring to include the private homes, for which the residents would pay.
However Dr Heilig declined to participate because the MCQ manager disallowed it.
6. The Maximum Allowed blasts > 10mm/second, also has rules relating to sequential counting within any 12 month period.
7. Extrapolated data is normally only used when measured data is unavaiilable, at the time the MCLR were unaware of the locally measured BCC MCQ Secret data .
The RTI data was investigated by a qualified and well experienced statistician.
8. However the results shown above are highly indicative and is thus raising the concern of many residents.
Whilst for other local residents, this data confirms what they had already experienced.
9. The EDO analysis of the Schedule-F Blasting License indicated that monitoring inside private homes is a totally valid requirement.
If there is any doubt, then please contact the MCLR ASAP.
Top of Page
Calculate Extrapolated Private Home & Stuartholme Vibration Data.
Calculate the Vibration level Groups Counts in Chart Form.
Apparent or Indicated Excess Counts (in the home).


